雅思英语类别:
雅思口语一对一陪练,托福口语,日常英语口语,商务英语口语,以及幼儿英语口语。
同时本公司也承接雅思口语陪练,留学服务,雅思作文批改精批等业务。
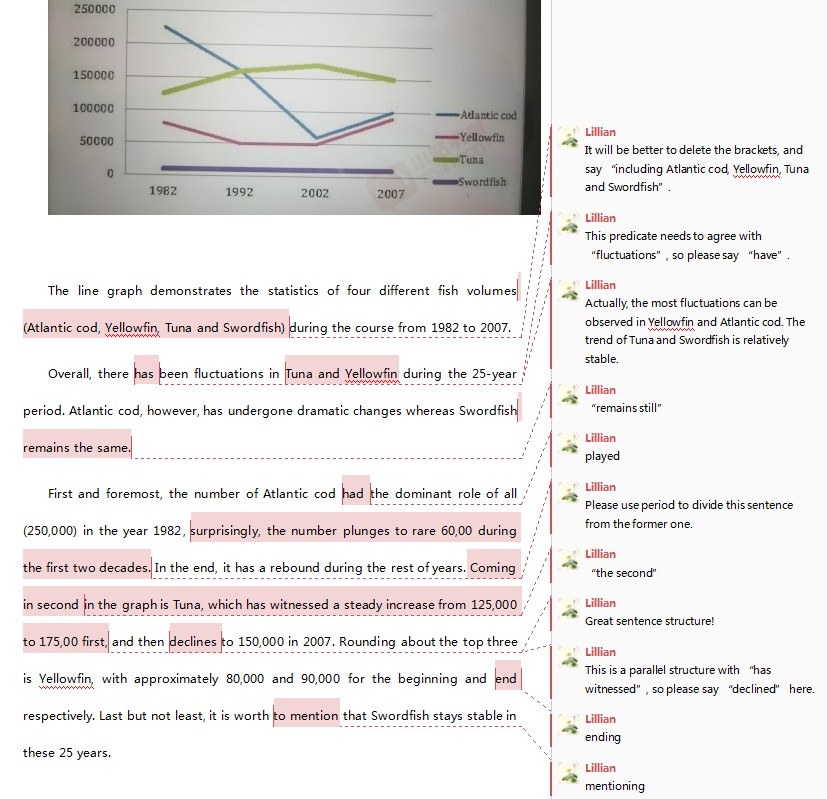
如下为同学雅思原文: The line graph demonstrates the statistics of four different fish volumes (Atlantic cod, Yellowfin, Tuna and Swordfish) during the course from 1982 to 2007. Overall, there has been fluctuations in Tuna and Yellowfin during the 25-year period. Atlantic cod, however, has undergone dramatic changes whereas Swordfish remains the same. First and foremost, the number of Atlantic cod had the dominant role of all (250,000) in the year 1982, surprisingly, the number plunges to rare 60,00 during the first two decades. In the end, it has a rebound during the rest of years. Coming in second in the graph is Tuna, which has witnessed a steady increase from 125,000 to 175,00 first, and then declines to 150,000 in 2007. Rounding about the top three is Yellowfin, with approximately 80,000 and 90,000 for the beginning and end respectively. Last but not least, it is worth to mention that Swordfish stays stable in these 25 years. 如下为外教修改后的作文:
|