微信客服账号:
yingyu660
English
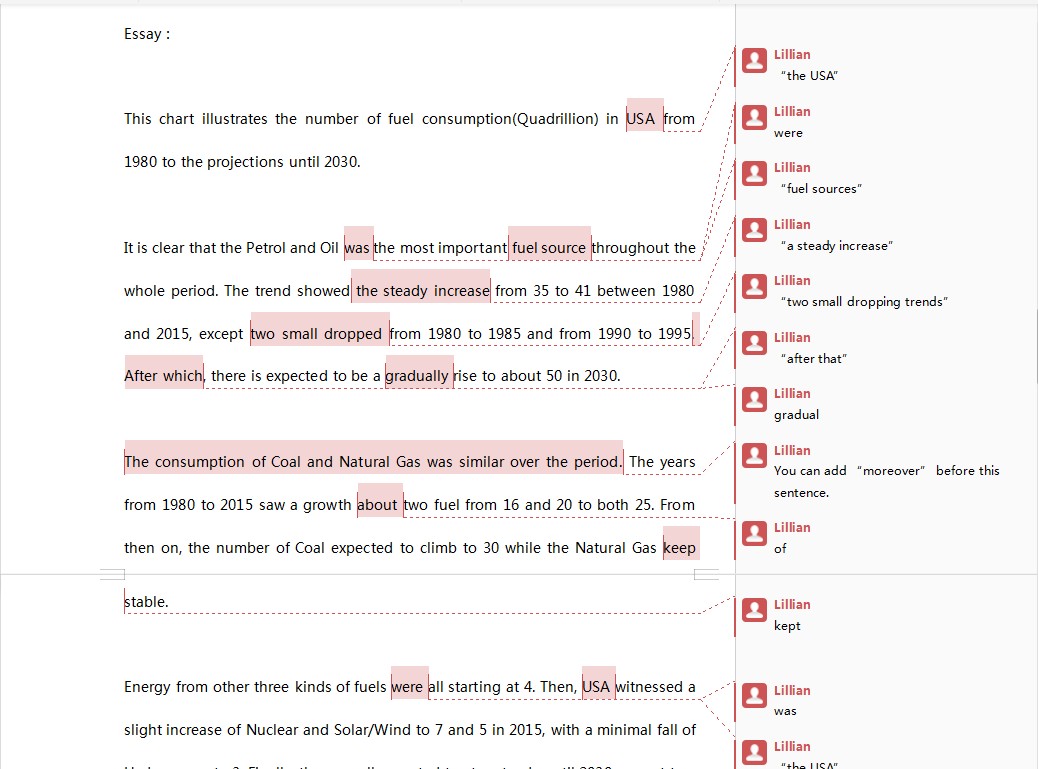
English陪练学习| 雅思英语类别: 雅思口语一对一陪练,托福口语,日常英语口语,商务英语口语,以及幼儿英语口语。 如下为同学雅思原文: Essay: This chart illustrates the number of fuel consumption(Quadrillion) in USA from 1980 to the projections until 2030. It is clear that the Petrol and Oil was the most important fuel source throughout the whole period. The trend showed the steady increase from 35 to 41 between 1980 and 2015, except two small dropped from 1980 to 1985 and from 1990 to 1995. After which, there is expected to be a gradually rise to about 50 in 2030. The consumption of Coal and Natural Gas was similar over the period. The years from 1980 to 2015 saw a growth about two fuel from 16 and 20 to both 25. From then on, the number of Coal expected to climb to 30 while the Natural Gas keep stable. Energy from other three kinds of fuels were all starting at 4. Then, USA witnessed a slight increase of Nuclear and Solar/Wind to 7 and 5 in 2015, with a minimal fall of Hydropower to 3. Finally, they are all expected to stay steady until 2030, except two marginal rise of Nuclear and Solar/Wind to 8 and 6. In conclusion, the America will mostly use Petrol and Oil for energy in the future, while Nuclear or Hydropower are not such important. 如下为外教修改后的作文:
|


扫描二维码添加微信好友