微信客服账号:
yingyu660
English
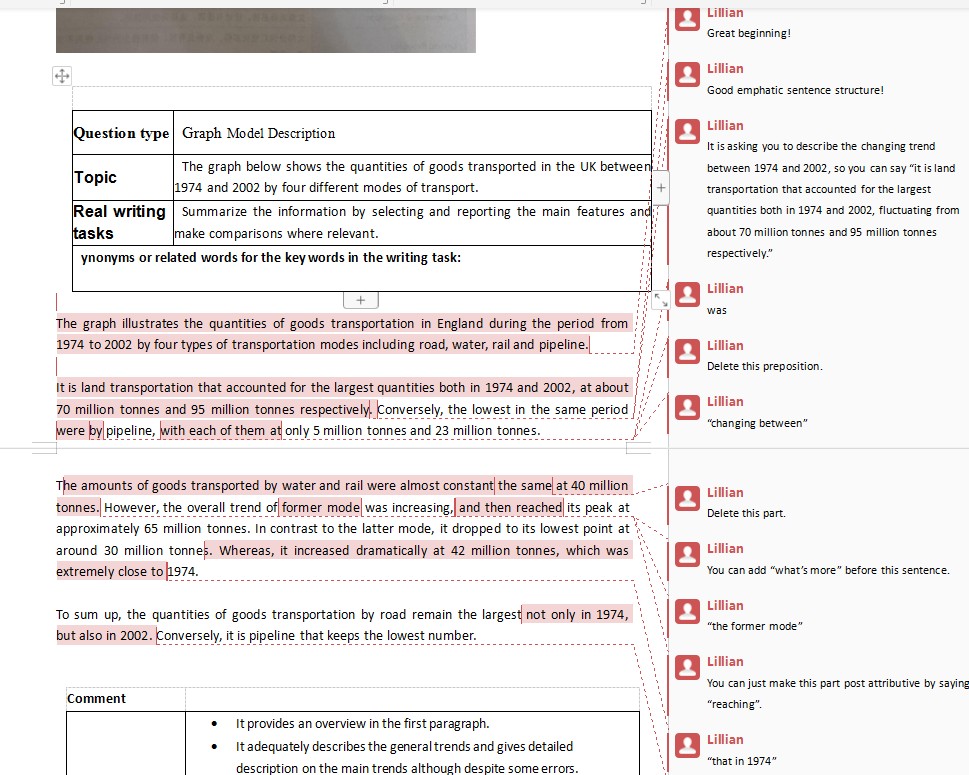
English陪练学习| 雅思英语类别: 雅思口语一对一陪练,托福口语,日常英语口语,商务英语口语,以及幼儿英语口语。 如下为同学雅思原文: The graph illustrates the quantities of goods transportation in England during the period from 1974 to 2002 by four types of transportation modes including road, water, rail and pipeline. It is land transportation that accounted for the largest quantities both in 1974 and 2002, at about 70 million tonnes and 95 million tonnes respectively. Conversely, the lowest in the same period were by pipeline, with each of them at only 5 million tonnes and 23 million tonnes. The amounts of goods transported by water and rail were almost constant the same at 40 million tonnes. However, the overall trend of former mode was increasing, and then reached its peak at approximately 65 million tonnes. In contrast to the latter mode, it dropped to its lowest point at around 30 million tonnes. Whereas, it increased dramatically at 42 million tonnes, which was extremely close to 1974. To sum up, the quantities of goods transportation by road remain the largest not only in 1974, but also in 2002. Conversely, it is pipeline that keeps the lowest number. 如下为外教修改后的作文:
|


扫描二维码添加微信好友