雅思英语类别: 雅思口语,托福口语,日常英语口语,商务英语口语,以及幼儿英语口语。 同时本公司也承接雅思口语陪练,留学服务,雅思作文批改等业务。
如下为同学雅思原文: The graph illustrates the tonnages of shipments delivered in the Uk
in 28 years time(1974-2002) by four different transportation methods. The amount of
commodities transported by road remained dominant in this period, although it
experienced a fluctuation from 1924 to 1995 .but that upwards trend was witnessed(78 million tonnes
in 1995 to 98 million tonnes in 2002).On the other hand. Pipeline, another way
to transport merchandises, Seemed to be the least popular among the four,
although. The amount of shipments delivered by pipeline steadily climbed from 5
million tonnes in 1974 to 22 million tonnes in 2002. As for the
quantifies of goods transported by water and rail, they were equal to each
other initially(both 40 million tonnes),After year 1978,the amount of shipments
transported by water outnumbered that of rail. From 1986,the gap between
these two ways remain approximately at
20 tonnes. Overall, rood, a
predominant transportation in UK, constituted the majority of all the goods
transported in 28 years. As to rail and water, albeit keep equlity for a short
period of time. The gap between them was eventually widen.
如下为外教修改后的作文: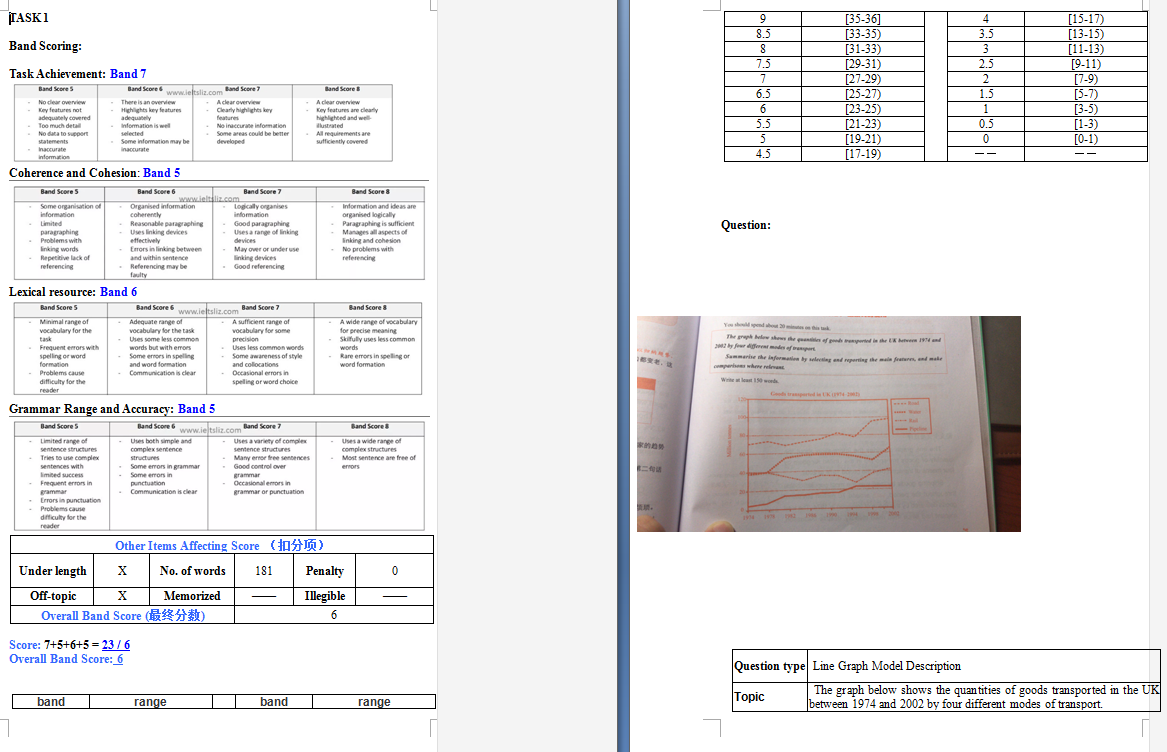  如下为下载链接(包含了同学原片以及修改后的,请下载后电脑查看,手机无法看到完整版):
雅思作文批改.rar
|