微信客服账号:
yingyu660
English
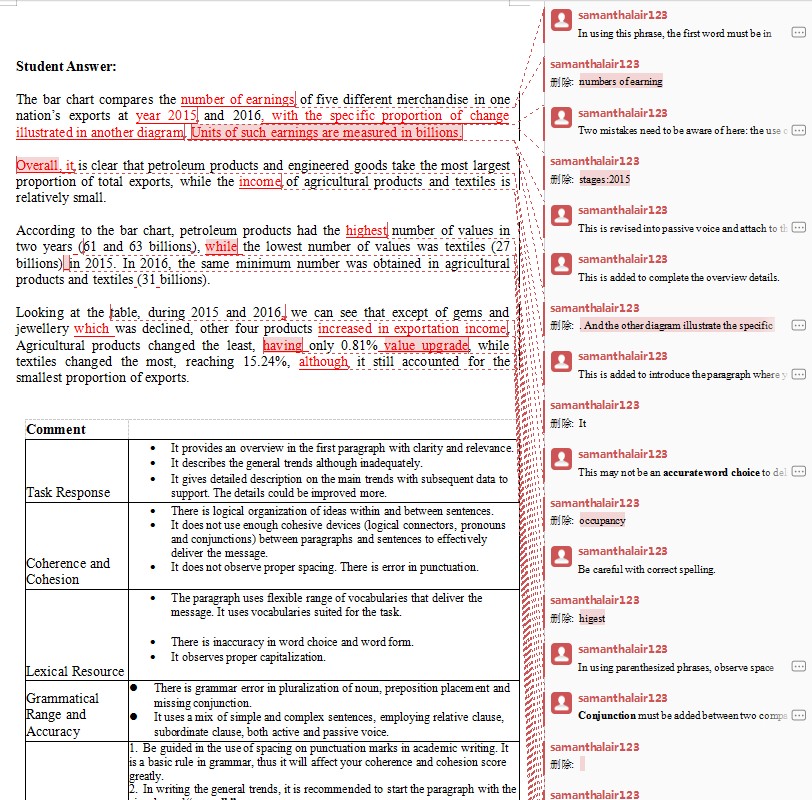
English陪练学习| 雅思英语类别: 雅思口语一对一陪练,托福口语,日常英语口语,商务英语口语,以及幼儿英语口语。 同时本公司也承接雅思口语陪练,留学服务,雅思作文批改精批等业务。 如下为同学雅思原文: The bar chart compares the numbers of earning of five different merchandise in one nation’s exports at stages:2015 and 2016. And the other diagram illustrate the specific proportion of change. It is clear that petroleum products and engineered goods take the most largest proportion of total exports, while the occupancy of agricultural products and textiles is relatively small. According to the bar chart, petroleum products had the higest number of values in two years( 61 and 63 billions ), the lowest number of values was textiles (27billions)in 2015. In 2016, the same minimum number was obtained in agricultural products and textiles(31billions). Looking at the below table, during 2015 and 2016. we can see that except of gems and jewellery was declined, other four products were grown up. Agricultural products changed the least, only 0.81%, while textiles changed the most, reaching 15.24%, but it still accounted for the smallest proportion of exports. 如下为外教修改后的作文:
如下为下载链接(包含了同学原片以及修改后的,请下载后电脑查看,手机无法看到完整版): |


扫描二维码添加微信好友