微信客服账号:
yingyu660
English
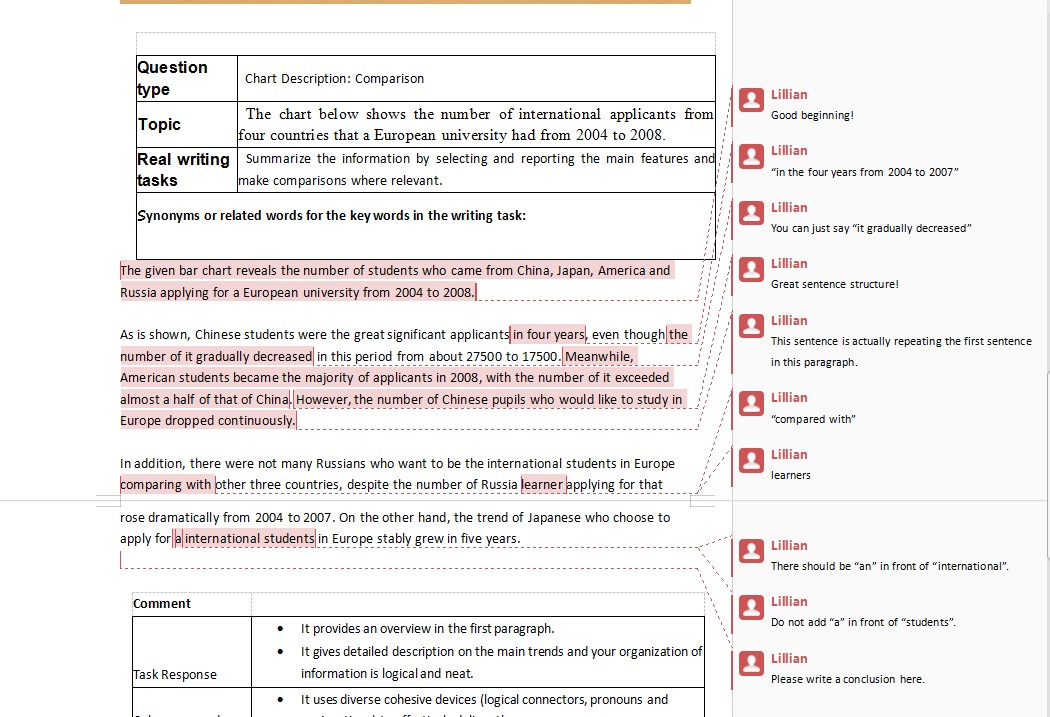
English陪练学习| 雅思英语类别: 雅思口语一对一陪练,托福口语,日常英语口语,商务英语口语,以及幼儿英语口语。 如下为同学雅思原文: The given bar chart reveals the number of students who came from China, Japan, America and Russia applying for a European university from 2004 to 2008. As is shown, Chinese students were the great significant applicants in four years, even though the number of it gradually decreased in this period from about 27500 to 17500. Meanwhile, American students became the majority of applicants in 2008, with the number of it exceeded almost a half of that of China. However, the number of Chinese pupils who would like to study in Europe dropped continuously. In addition, there were not many Russians who want to be the international students in Europe comparing with other three countries, despite the number of Russia learner applying for that rose dramatically from 2004 to 2007. On the other hand, the trend of Japanese who choose to apply for a international students in Europe stably grew in five years. 如下为外教修改后的作文:
|


扫描二维码添加微信好友