雅思英语类别: 雅思口语一对一陪练,托福口语,日常英语口语,商务英语口语,以及幼儿英语口语。
同时本公司也承接雅思口语陪练,留学服务,雅思作文批改精批等业务。
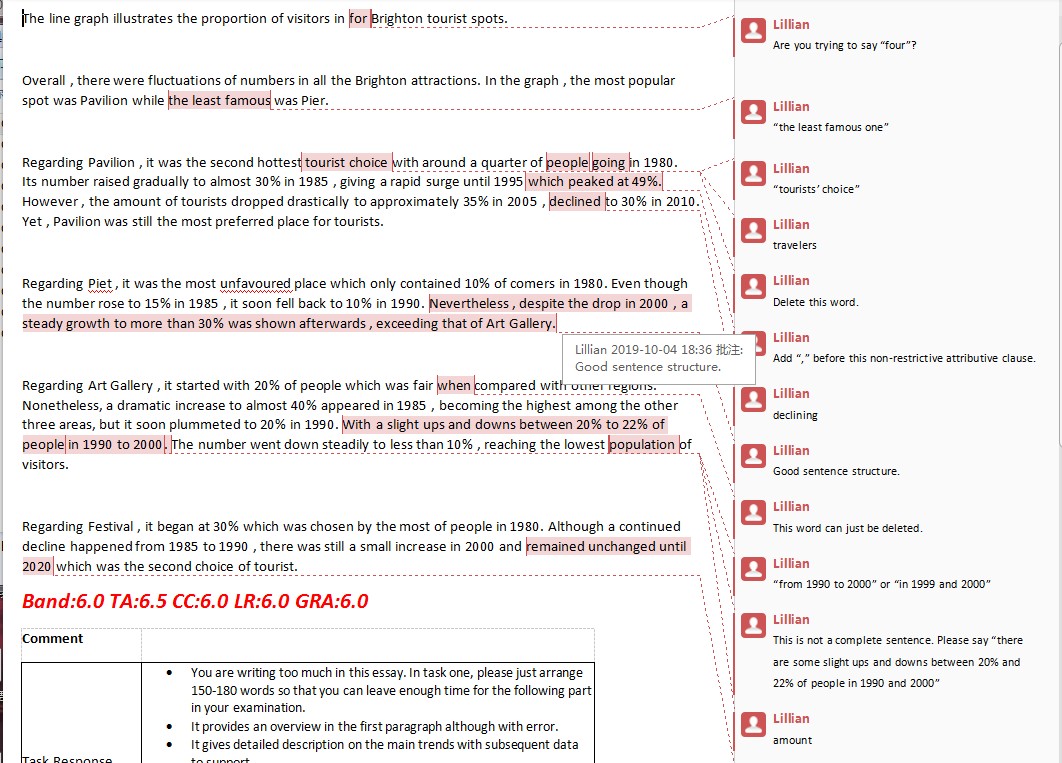
如下为同学雅思原文: The line graph illustrates the proportion of visitors in for Brighton tourist spots. Overall , there were fluctuations of numbers in all the Brighton attractions. In the graph , the most popular spot was Pavilion while the least famous was Pier. Regarding Pavilion , it was the second hottest tourist choice with around a quarter of people going in 1980. Its number raised gradually to almost 30% in 1985 , giving a rapid surge until 1995 which peaked at 49%. However , the amount of tourists dropped drastically to approximately 35% in 2005 , declined to 30% in 2010. Yet , Pavilion was still the most preferred place for tourists. Regarding Piet , it was the most unfavoured place which only contained 10% of comers in 1980. Even though the number rose to 15% in 1985 , it soon fell back to 10% in 1990. Nevertheless , despite the drop in 2000 , a steady growth to more than 30% was shown afterwards , exceeding that of Art Gallery. Regarding Art Gallery , it started with 20% of people which was fair when compared with other regions. Nonetheless, a dramatic increase to almost 40% appeared in 1985 , becoming the highest among the other three areas, but it soon plummeted to 20% in 1990. With a slight ups and downs between 20% to 22% of people in 1990 to 2000. The number went down steadily to less than 10% , reaching the lowest population of visitors. Regarding Festival , it began at 30% which was chosen by the most of people in 1980. Although a continued decline happened from 1985 to 1990 , there was still a small increase in 2000 and remained unchanged until 2020 which was the second choice of tourist. 如下为外教修改后的作文: 
| 